
Reports & insights
The numbers that run a fire & security business, live.
Every figure is calculated from your real jobs, jobsheets, invoices and quotes, so it's always current. No exporting to spreadsheets just to see how the month is going.
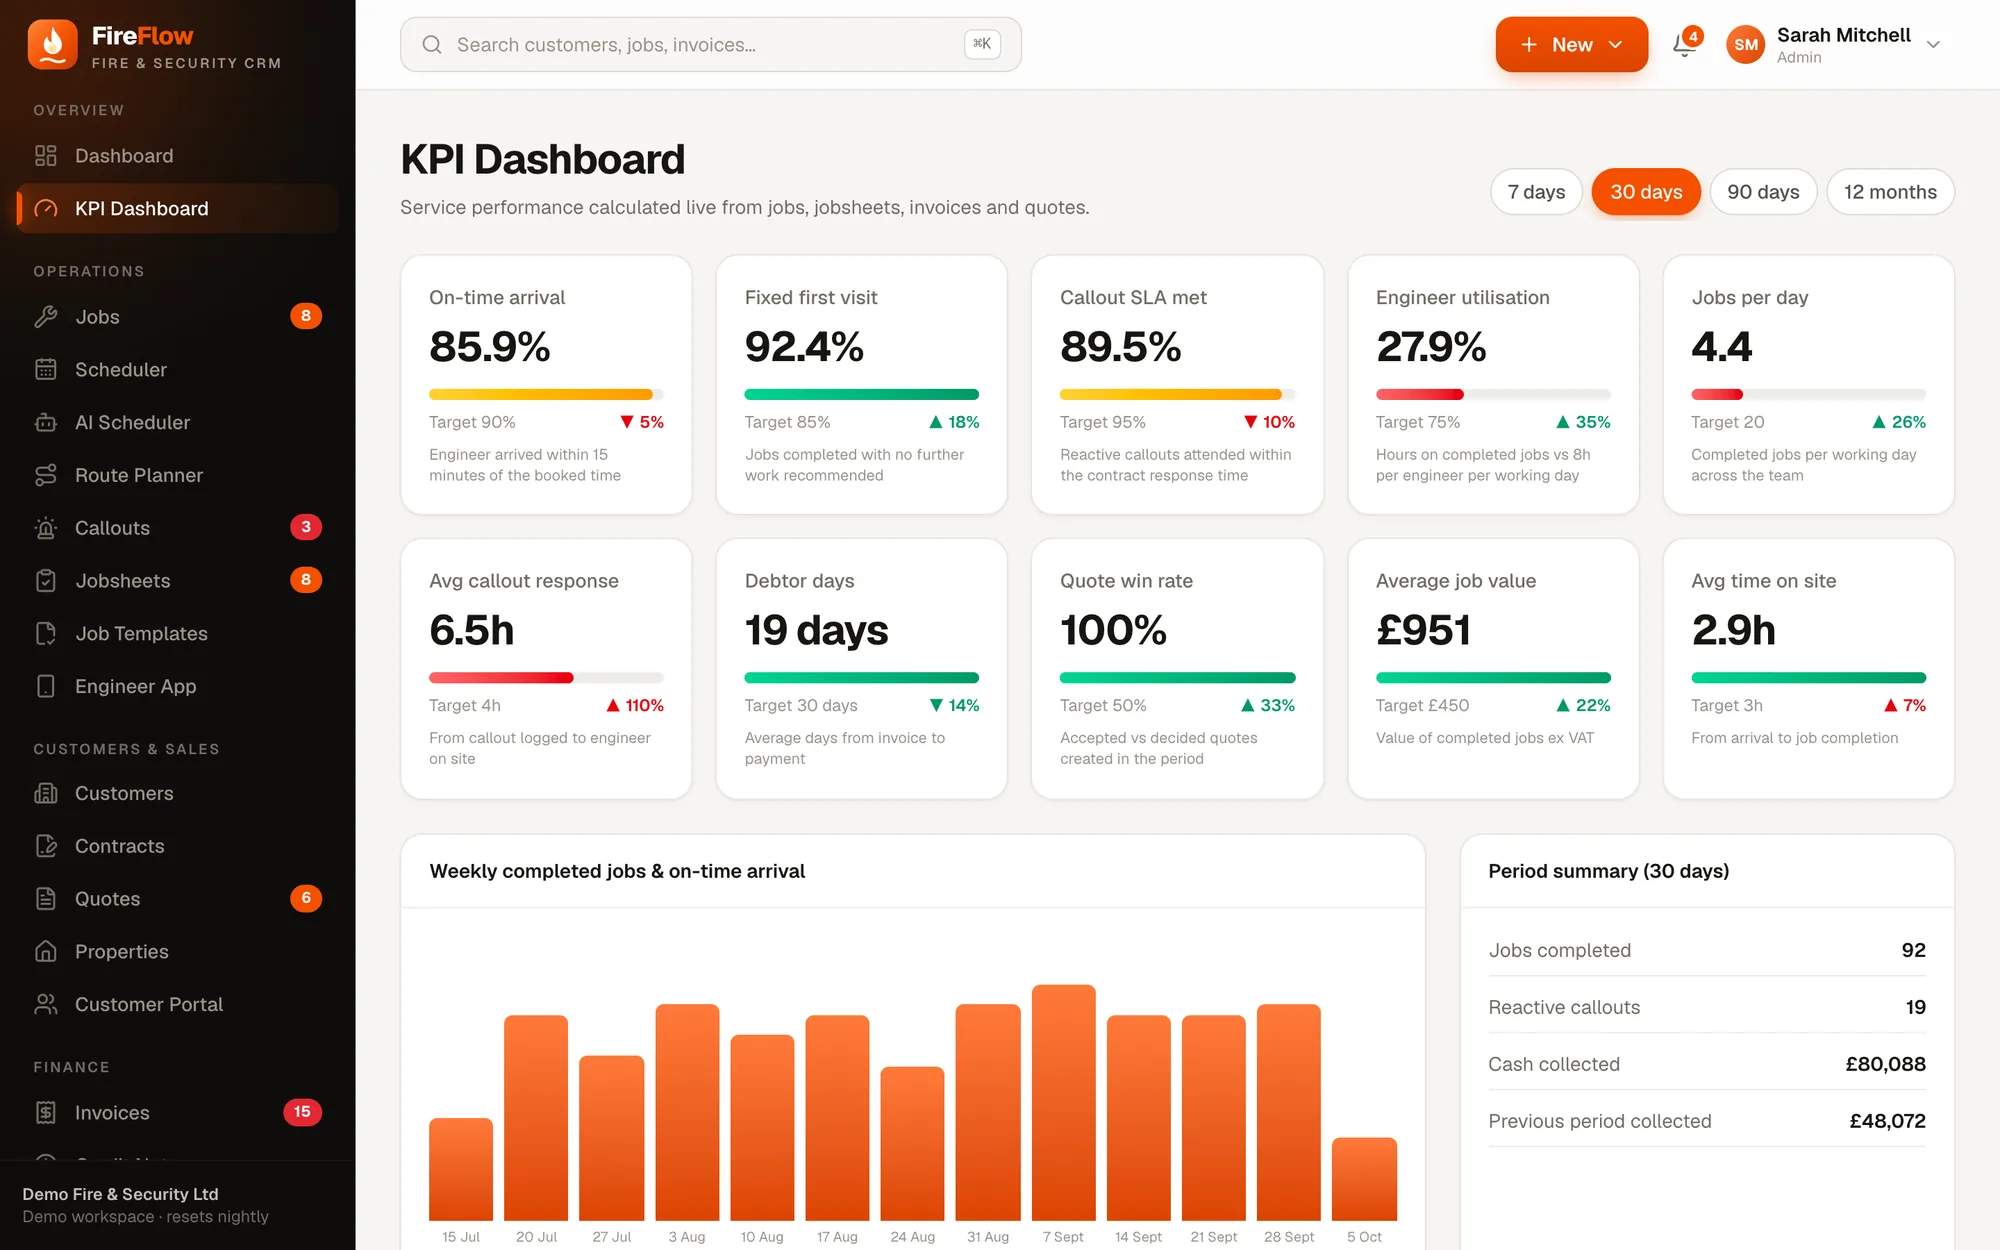
Dashboard
Your morning briefing, ready when you sign in.
The dashboard tells the office what needs doing today and the owner how the business is doing this month.
- 1Jobs waiting for an engineerWith a shortcut to auto-schedule them.
- 2Money in and outCollected this month, outstanding, overdue, jobs today and quote win rate.
- 312-month revenueCollected against invoiced, month by month.
- 4Needs attentionOverdue invoices and contracts coming up for renewal.
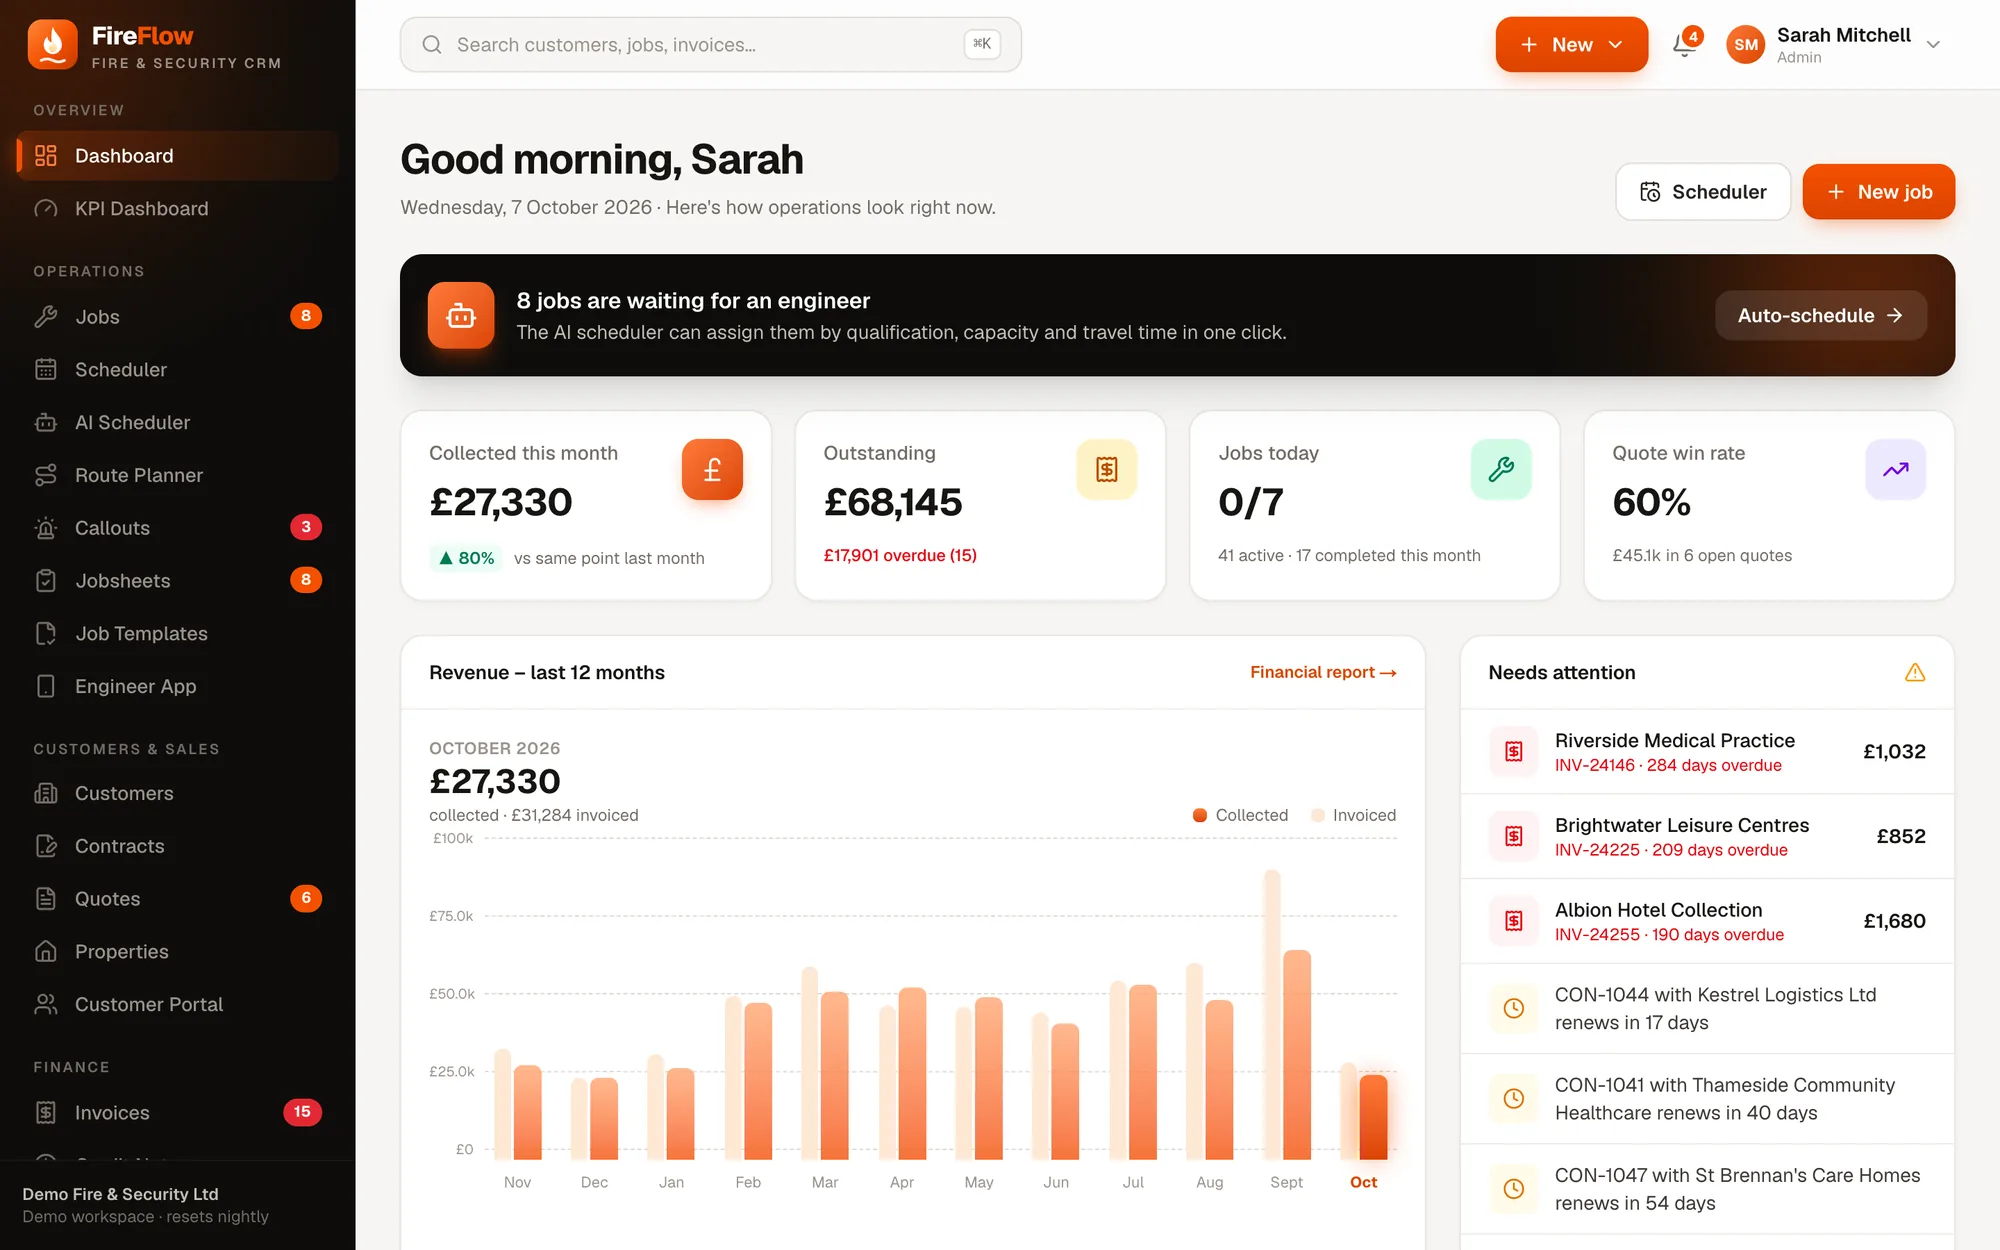
KPI dashboard
Service performance, measured honestly.
Ten KPIs that matter in fire & security, each with a target and its trend against the previous period. Switch between 7 days, 30 days, 90 days and 12 months.
- 1On-time arrivalEngineers arriving within 15 minutes of the booked time.
- 2Callout SLA metReactive callouts attended within the contract's response time.
- 3Debtor daysAverage days from invoice to payment.
- 4Quote win rateAccepted against decided quotes.
- 5Any period7, 30 or 90 days, or 12 months.
Also: fixed first visit, engineer utilisation, jobs per day, average callout response, average job value and time on site.
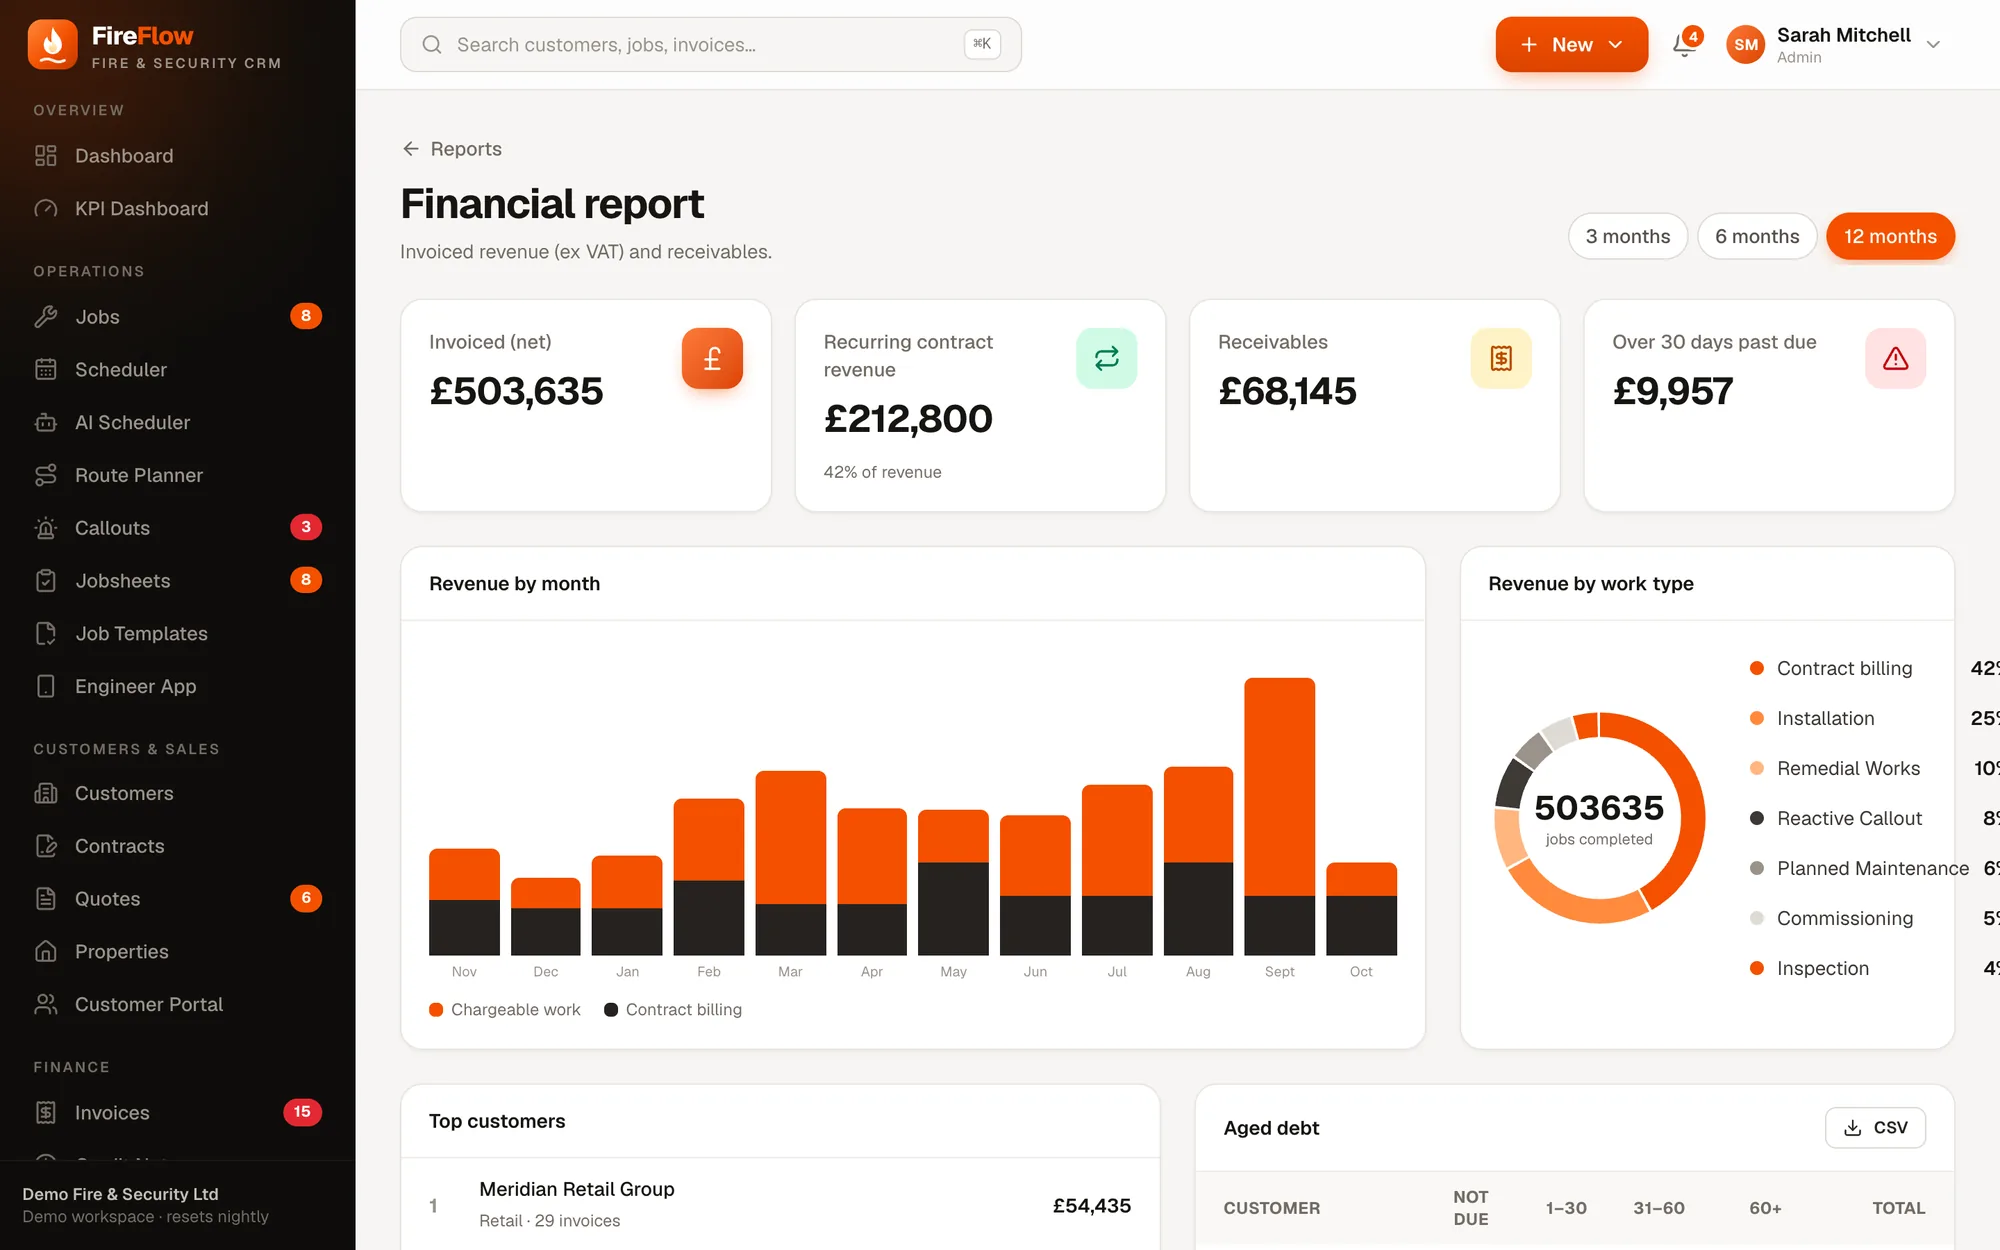
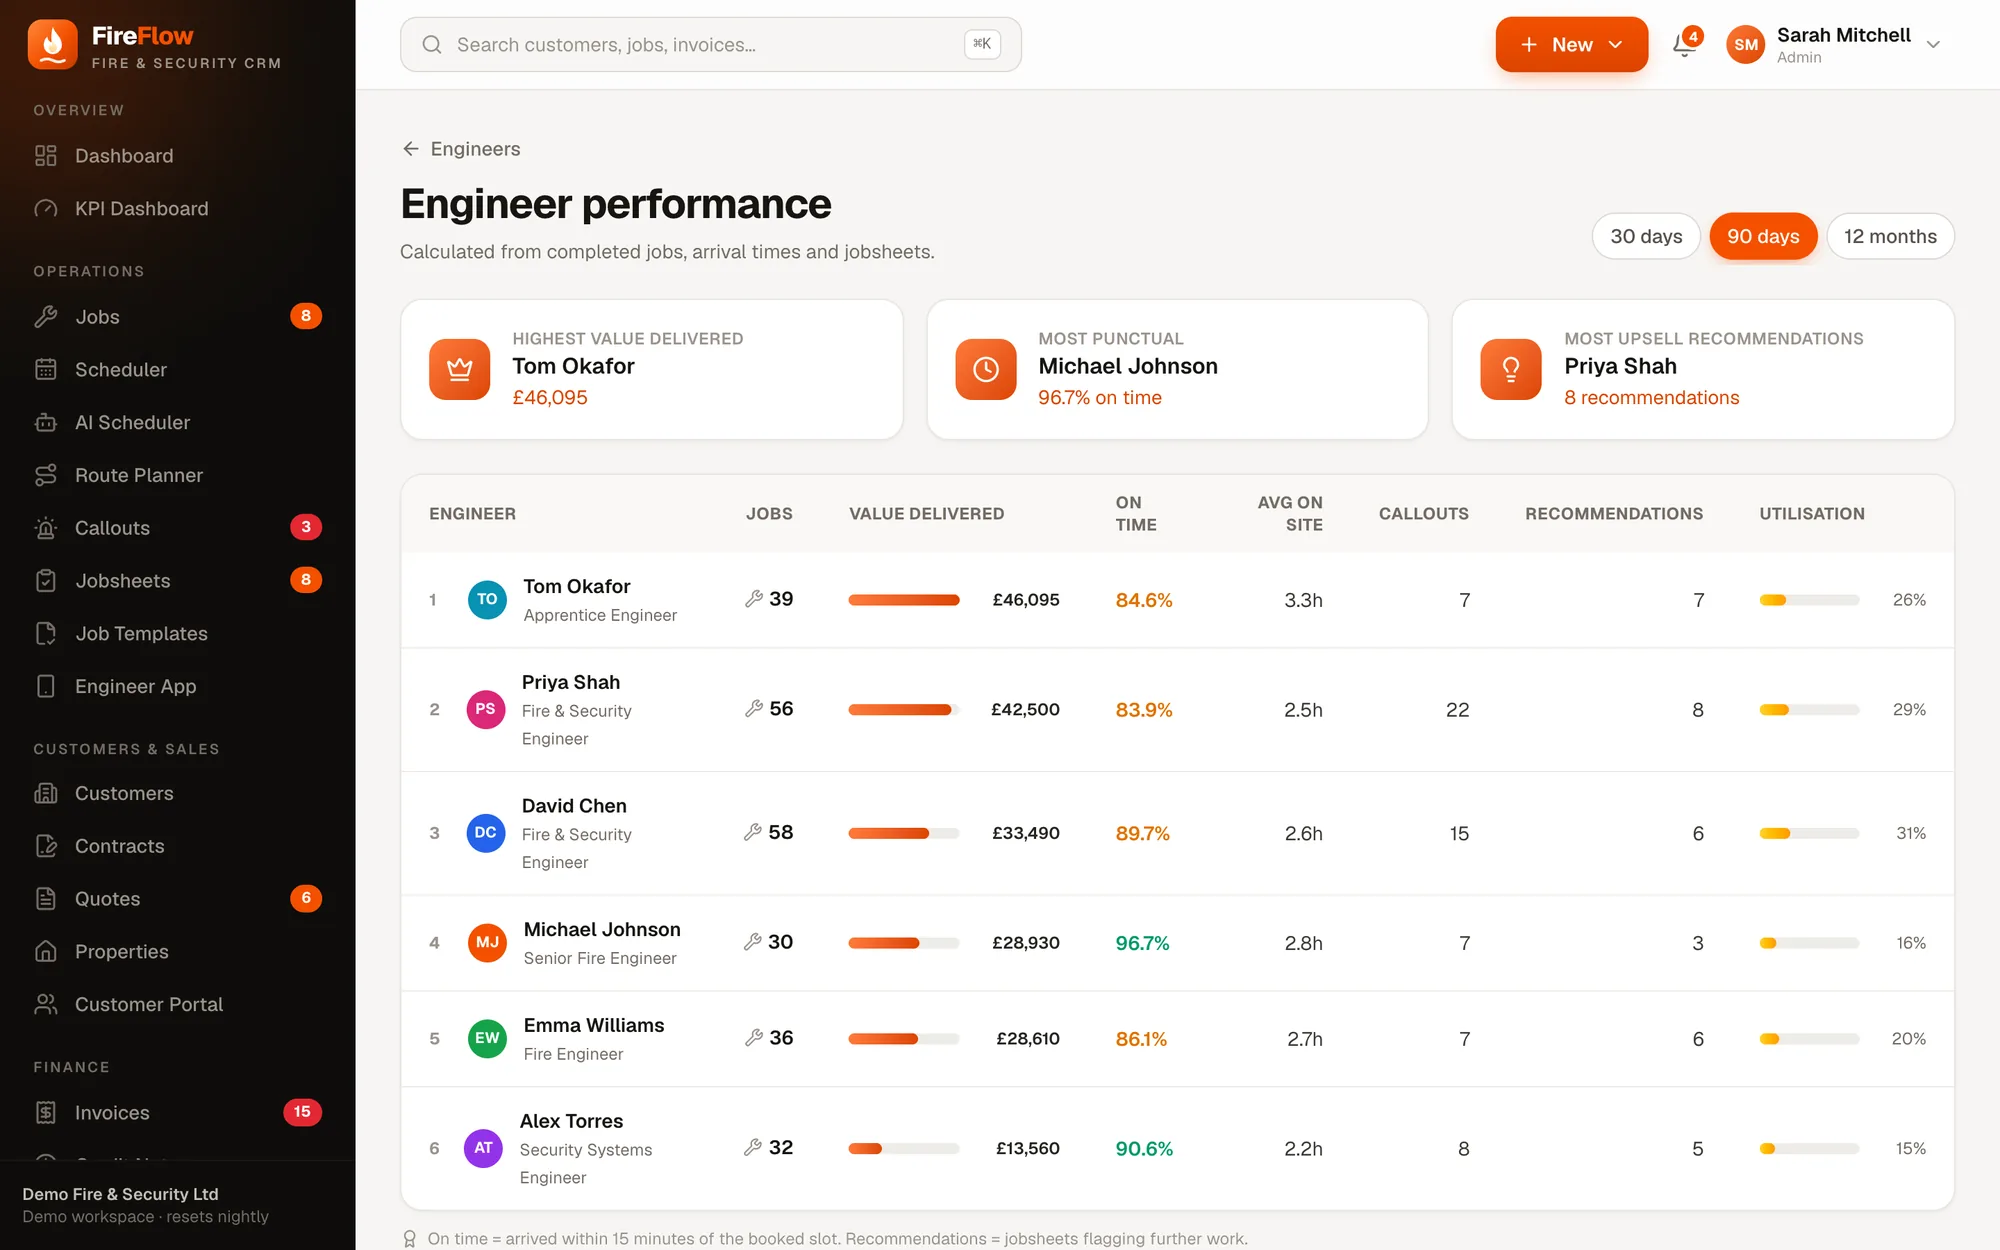
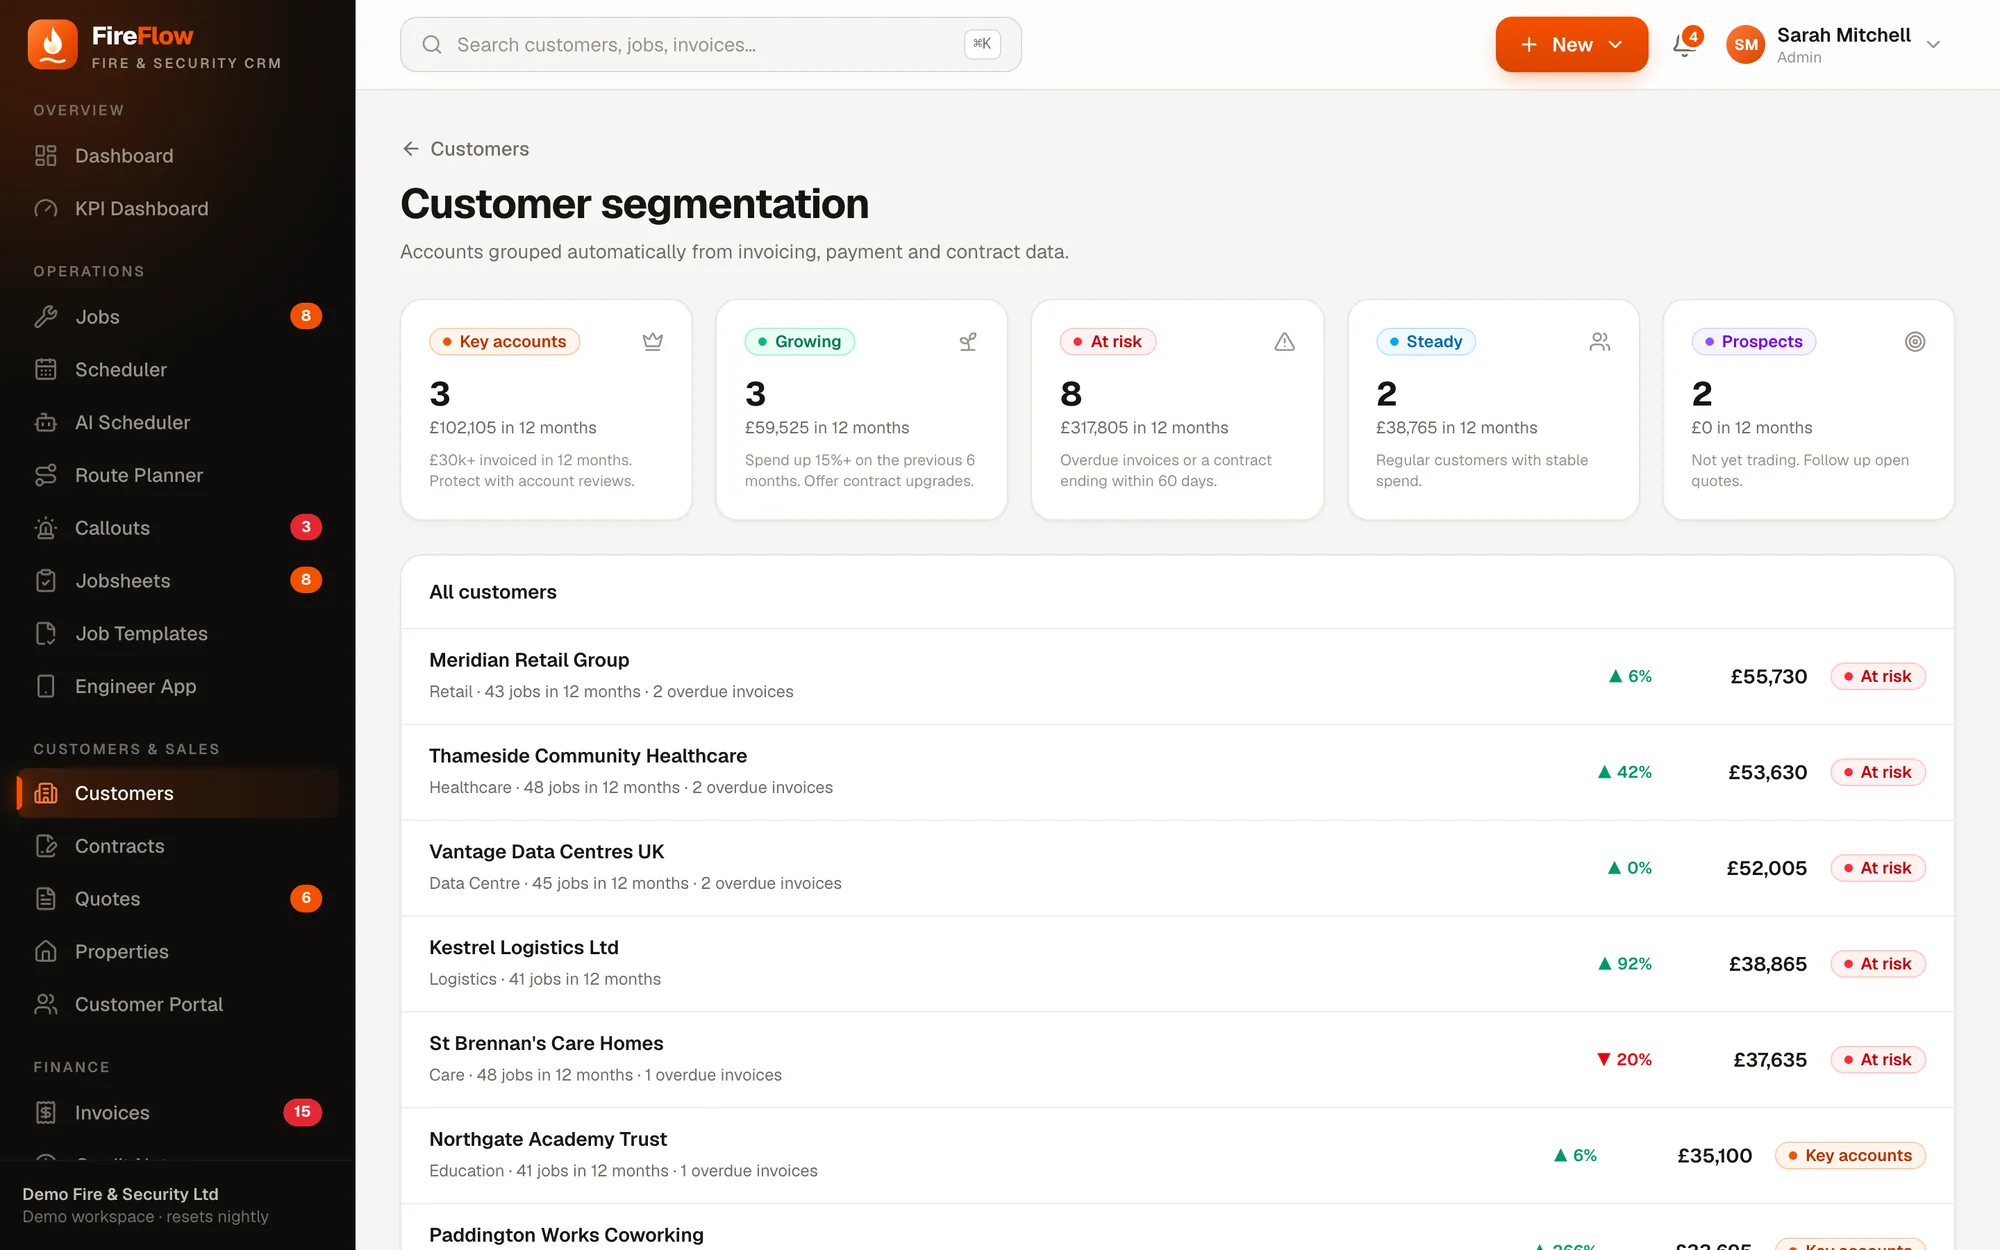
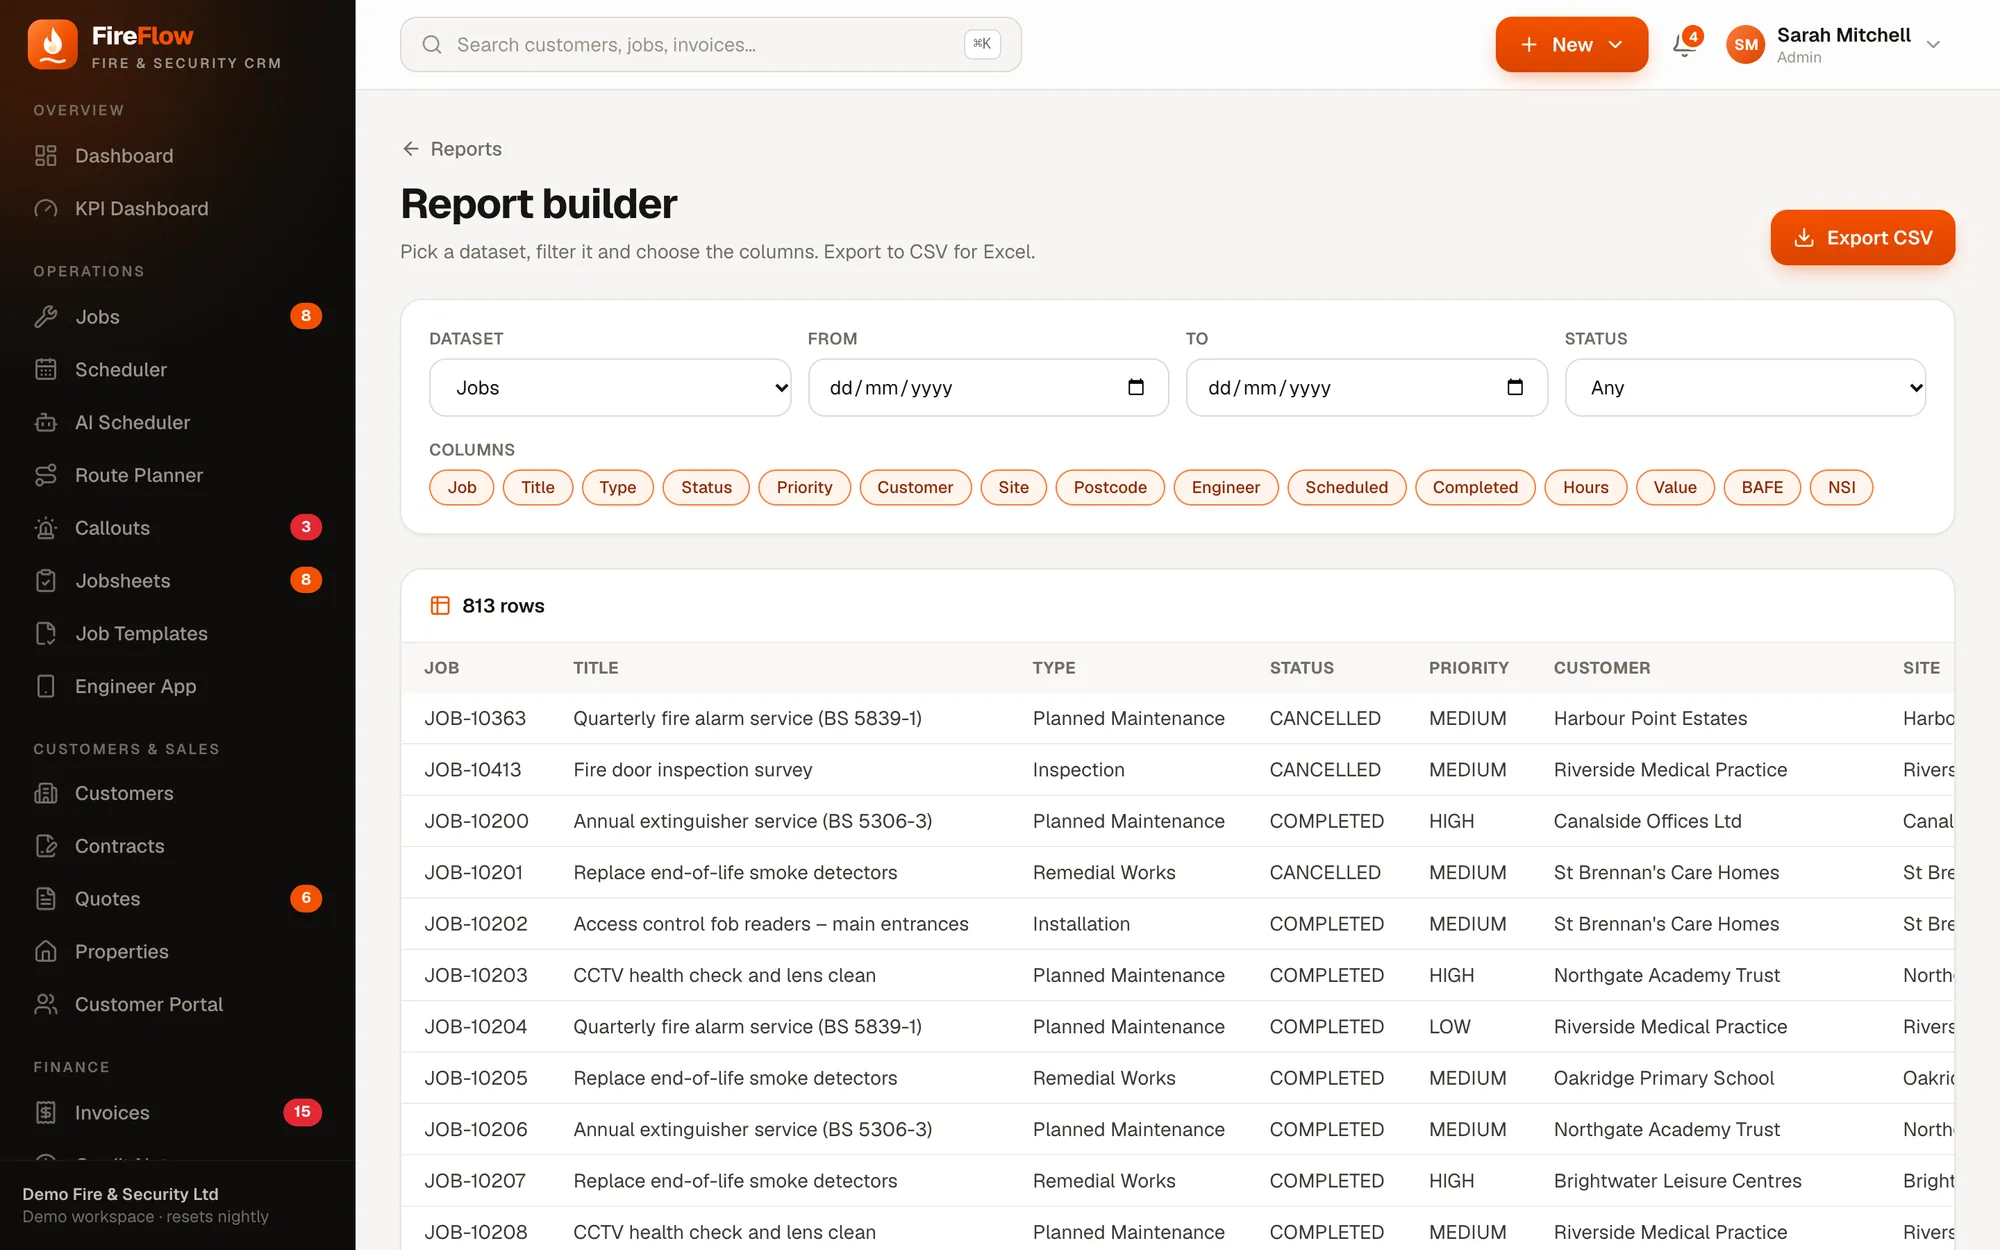
Reports
Answers to the questions owners actually ask.
Office tools
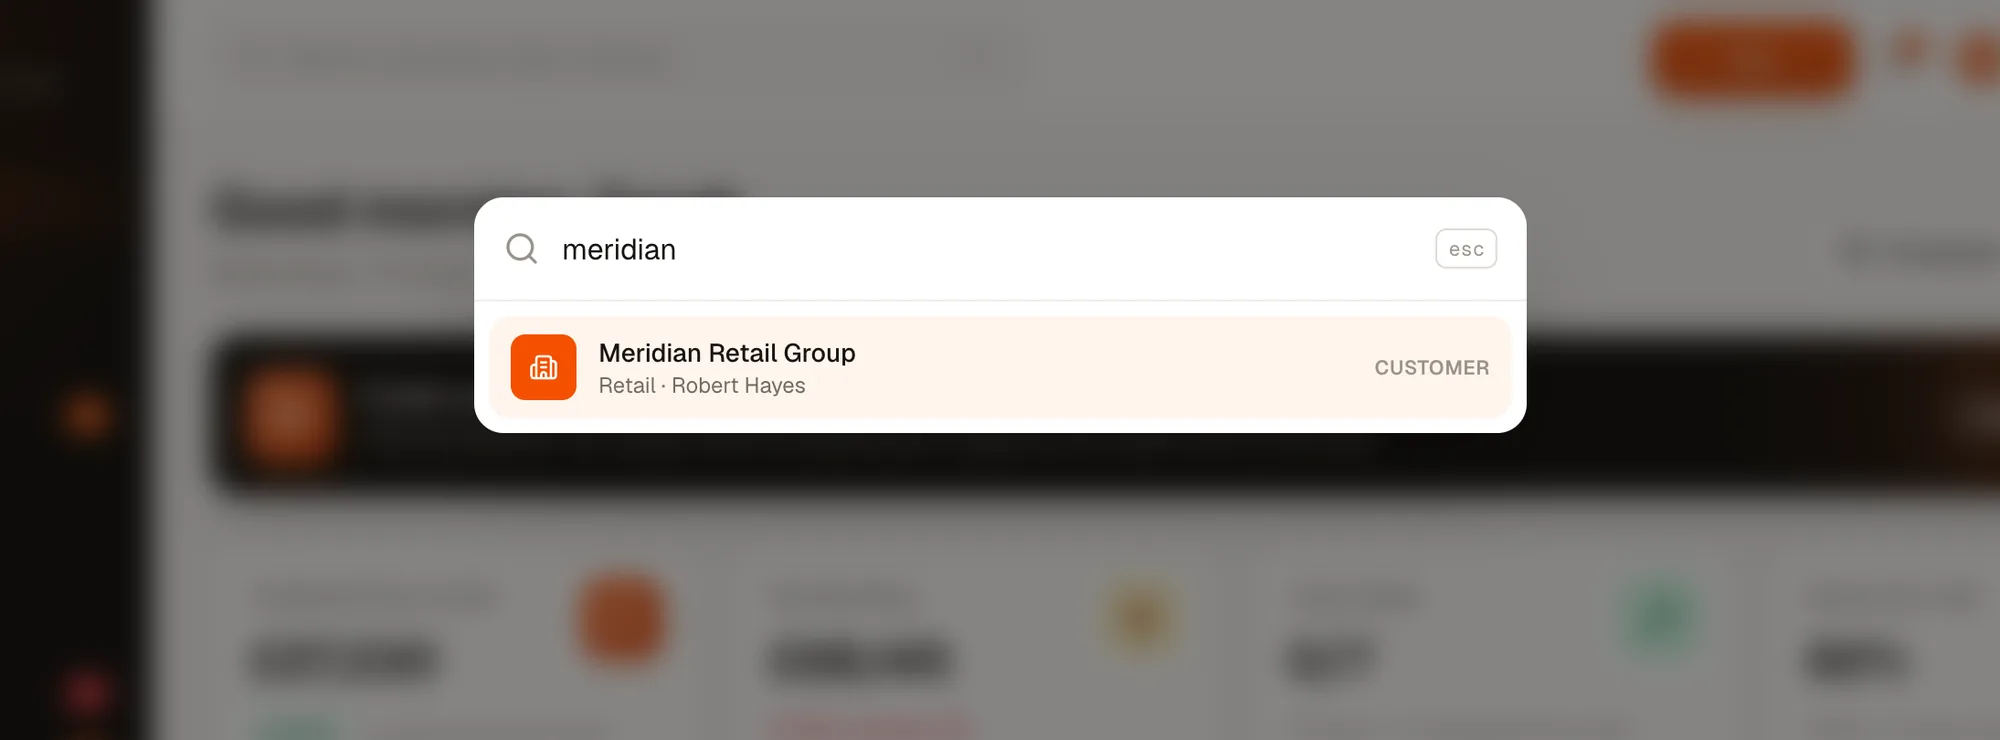
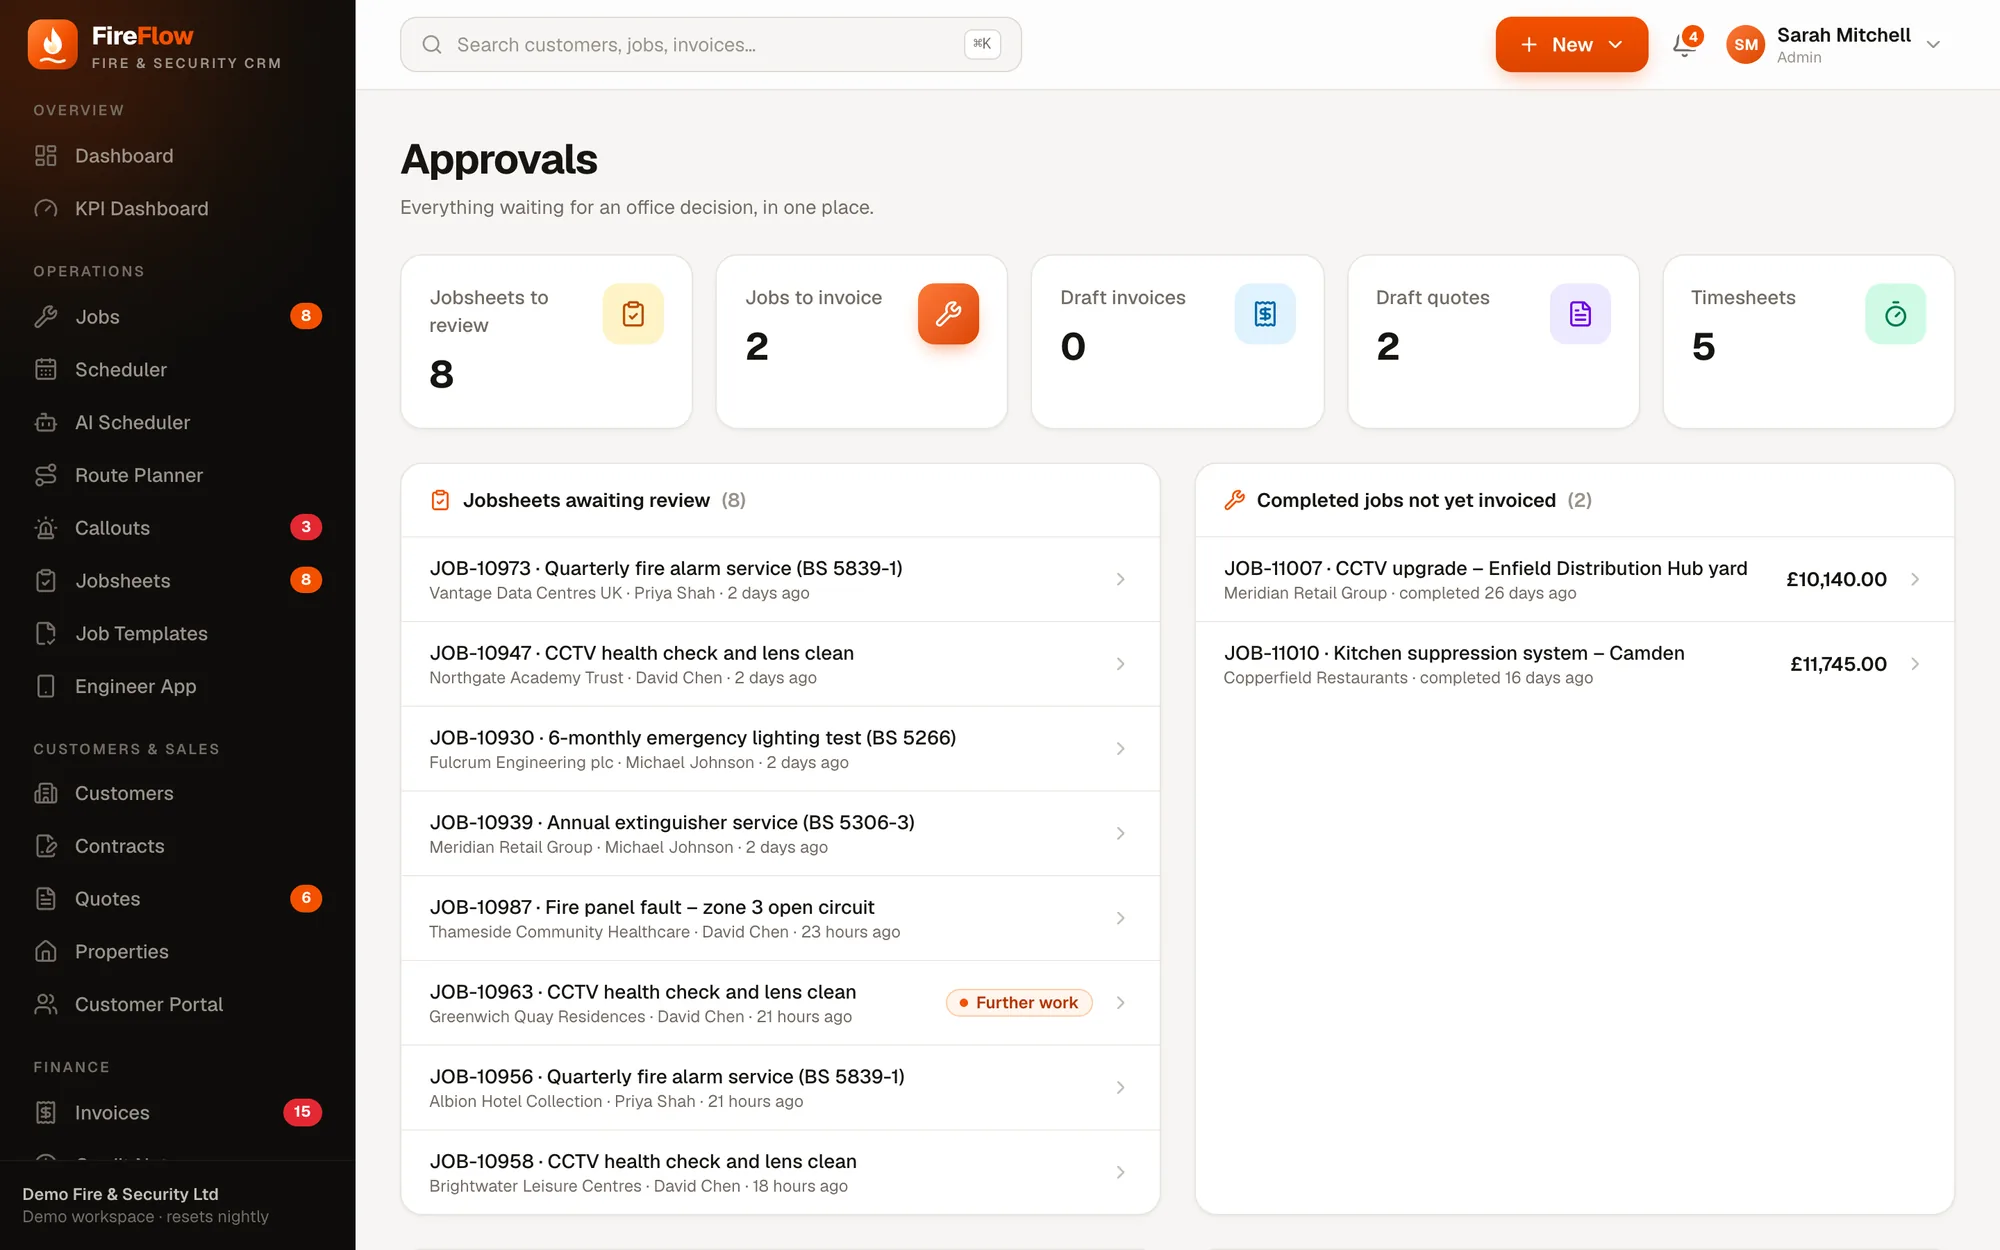
Find it fast. Decide it faster.
See it on your own work
Bring a real job. We'll run it through FireFlow live.
A 20–30 minute walkthrough shaped around your company: your callouts, your contracts, your engineers. Then we'll talk about what it would look like for you.